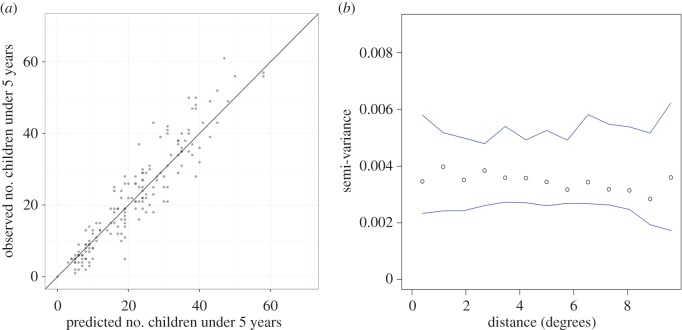
Figure 2.
Validation plots showing. (a) Scatter plot of the association between the observed against predictions of the 10% subset data (n = 1624) and (b) semi-variogram plot (y-axis semi-variance and x-axis distance in degrees) and associated envelopes (minimum and maximum range expected by chance in the absence of spatial autocorrelation) of the standardized residuals. The semi-variogram is a measure of autocorrelation with distance. (Online version in colour.)

