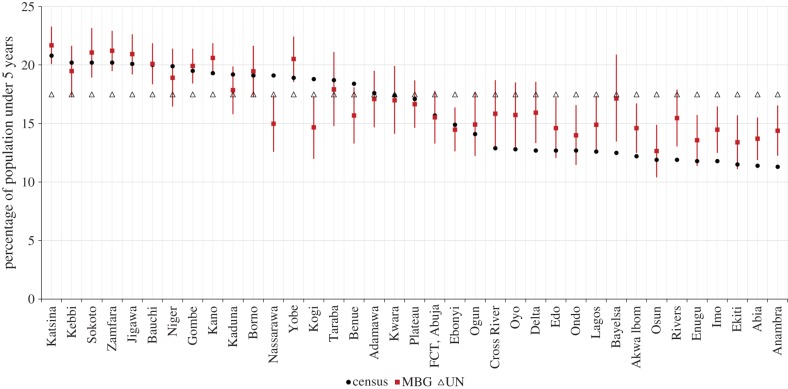
Figure 4.
Plot of the estimated percentage of children under the age of 5 years in Nigeria (y-axis) by state (x-axis) from the three different estimates namely: the model-based geostatistics (MBG) approach (red rectangles with Bayesian prediction intervals), the projected census estimates (black circles) and a single UN estimate value for the whole of Nigeria (triangles). The plot has been ordered by the census estimates. (Online version in colour.)

