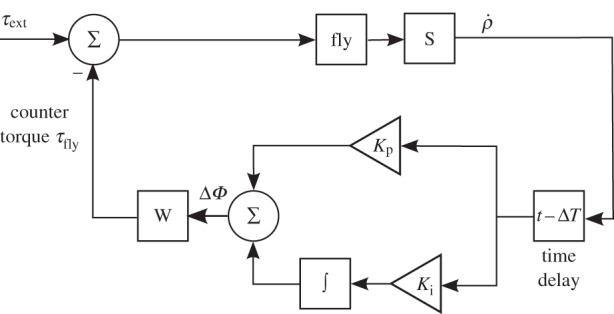
Figure 5.

Control block-diagram. The fly's dynamics is described by the fly block and the haltere sensors (S) measure its roll velocity  . The
. The  signal is fed into a time-delay block that represents a neuromuscular response time. The delayed signal is then split into two branches: the proportional term with the KP coefficient and the integral term with the Ki coefficient. The sum of both terms gives the actuation signal ΔΦ, also described in equation (3.1). The actuation signal is converted by the wings (W) into the counter-torque exerted by the fly. The counter-torque is opposite to the external perturbation torque τext, thereby forming a negative feedback loop that eventually corrects for the external perturbation.
