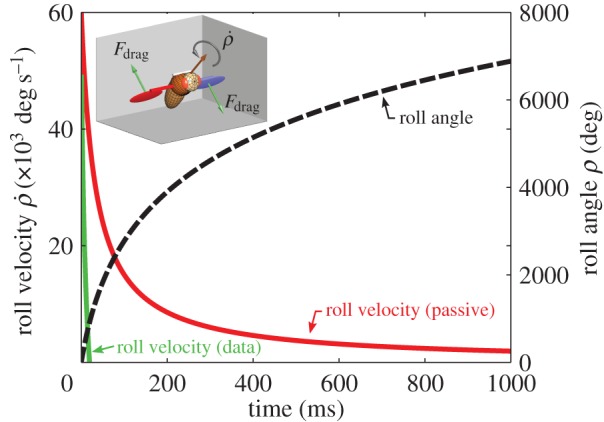
Figure 9.

The contribution of passive roll damping to the recovery from a roll extreme perturbation. Plotting the calculated dynamics of the roll velocity (red) and roll angle (dashed black line) under passive aerodynamic damping. The measured data for the roll velocity are copied from figure 8c (green). The calculation assumed an upper limit for the damping torque. The initial condition consisted of a roll velocity of 60 000° s−1 as in the experiment described in figure 4, and zero roll angle at t = 0. The slow approximately 1/t decay of the roll velocity indicates that passive damping alone cannot explain the fast recovery observed in the experiment. Inset shows the configuration of the rotating fly. The fly is rotating about its roll axis (orange) and each wing is pitched to ψw = 45° such that its angle of attack with respect to the ambient air is 90°. The green arrows indicate the aerodynamic drag forces on each wing.
