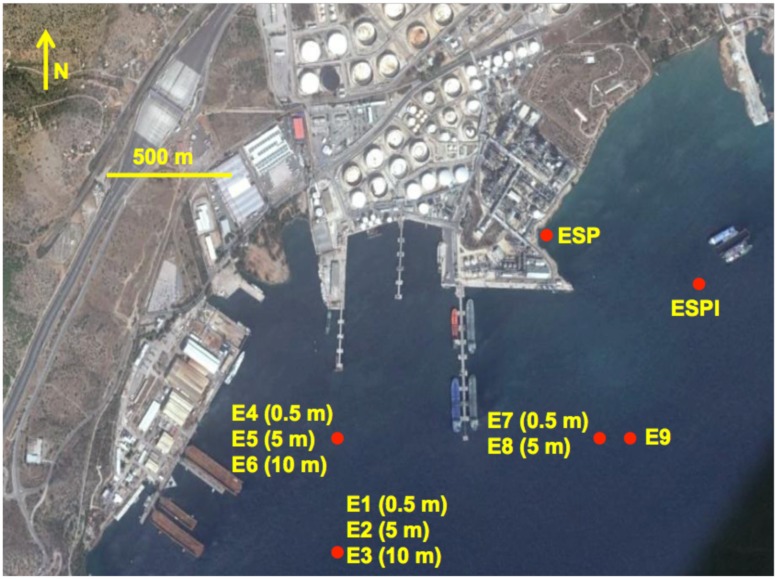
FIGURE 1.
The sampling campaign map. The locations of all the sampling sites are represented by red dots. The code(s) of the consortia isolated from each sampling site is given next to each dot. For consortia isolated from the water column, i.e., consortia E1–E8, the depth of the water sampled for initial inoculation is given in parenthesis next to the consortium code. The image was captured and modified using Google Earth.

