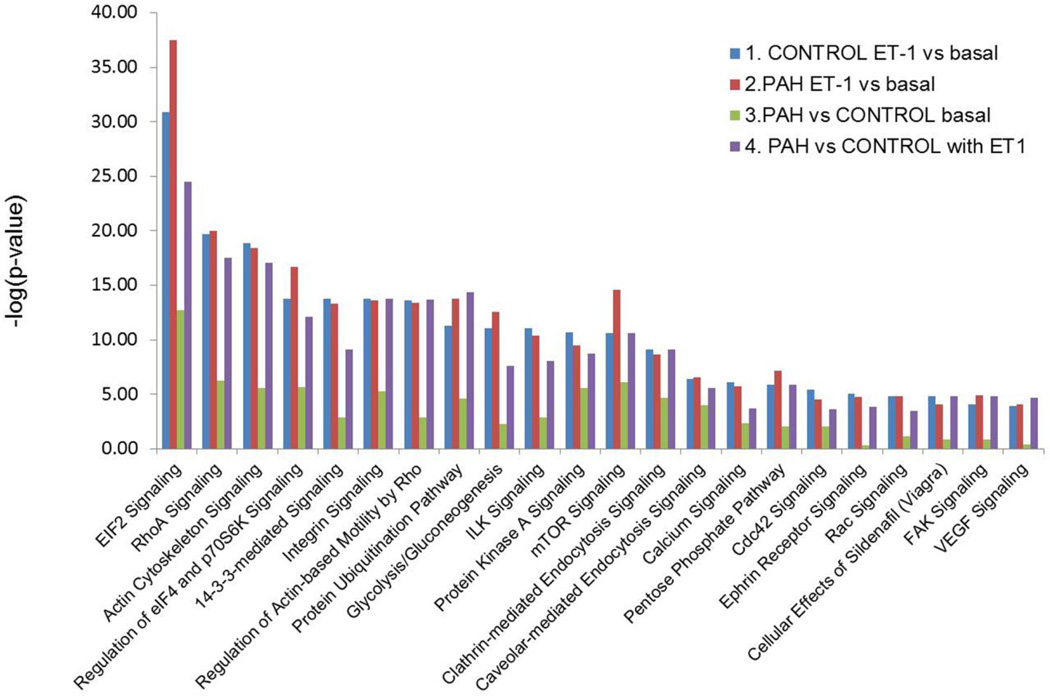
Figure 4.
Summary of the canonical pathways predicted by Ingenuity pathway analysis in the four-way comparisons. 1: ET-1 treated vs. basal in Control PASMC; 2. ET-1 treated vs. basal in PAH PASMC; 3. PAH cells vs. Control cell under basal conditions; 4. PAH vs. Control cells both with ET-1 stimulation. Canonical pathways analysis identified the pathways, from the Ingenuity Pathways Analysis™ library of canonical pathways, that were most significant to the dataset. Proteins from the dataset that met the fold change cutoff of 1.33 and were associated with a canonical pathway in the Ingenuity knowledge base were considered for analysis. The significance of the association between the dataset and the canonical pathway was determined as a p-value calculated by Fisher's exact test, a measure of the probability that the association between the proteins in the dataset and the canonical pathway is taking place by chance alone.

