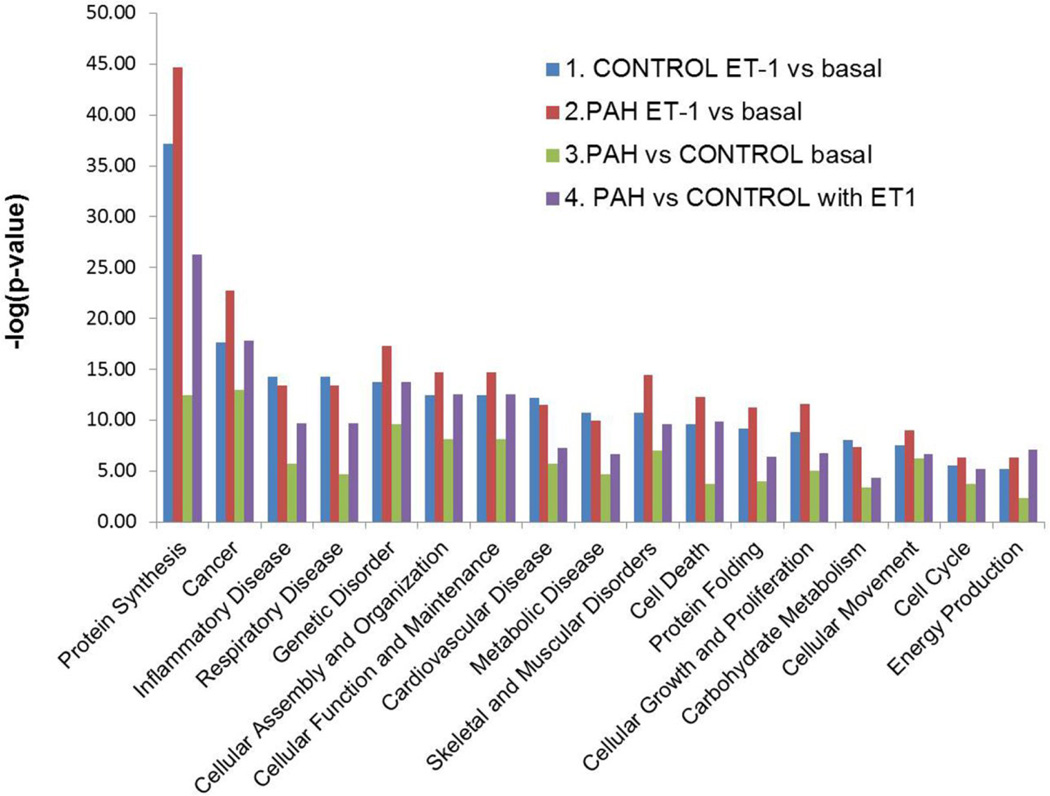
Figure 5.
Summary of the biological functions generated by Ingenuity Pathway Analysis in the 4-way comparisons. The Biological Functional Analysis™ identified the biological functions and/or diseases that are most significant to the data set. Fischer's exact test was used to calculate a p-value determining the probability that each biological function and/or disease assigned to that data set is

