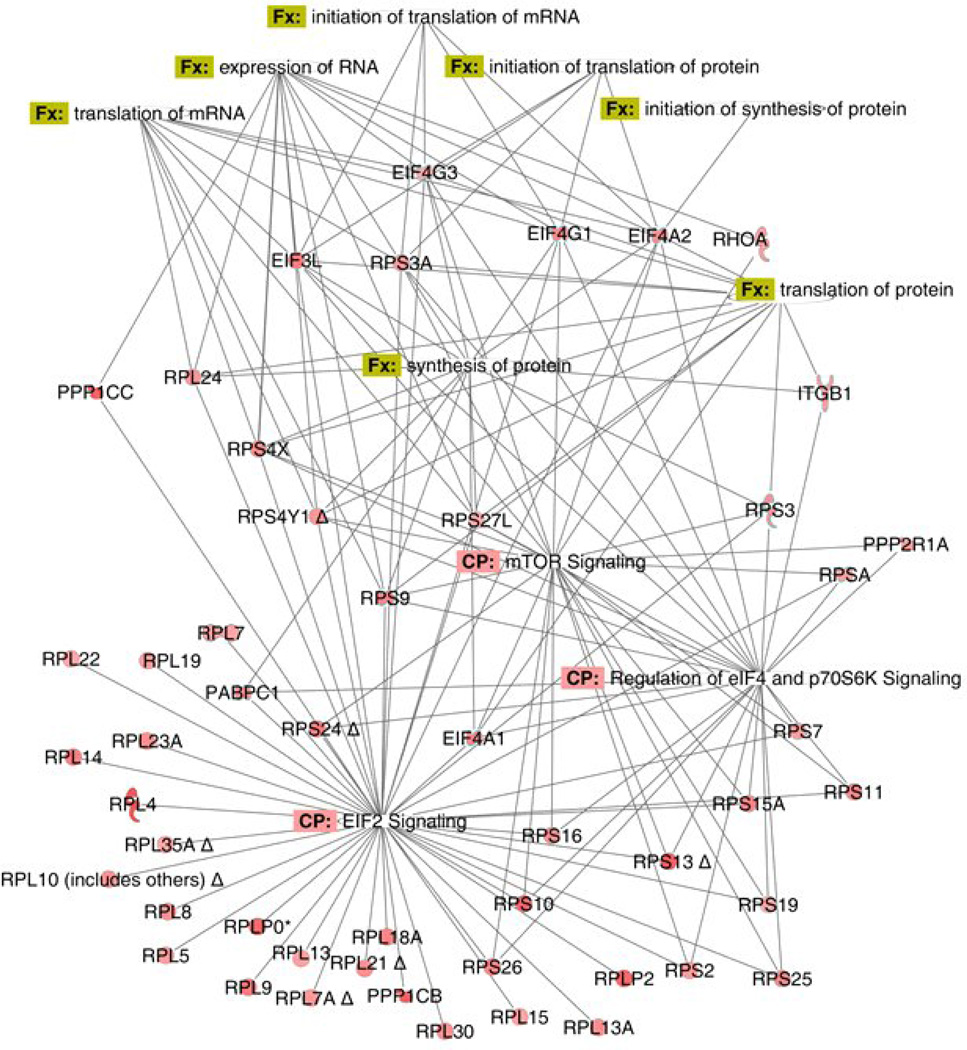
Figure 6.
Diagram of the differentially expressed proteins related to protein synthesis in ET-1 treated vs. basal in Control PASMC. The nodes represent different proteins. Green indicates down-regulation, red indicates up-regulation, and color intensity is proportional to fold change. The full name and fold changes of these proteins can be found in Supplementary Table 3. The annotations are supported by at least one reference from the literature, a textbook, or canonical information stored in the Ingenuity knowledge base.

