Figure 3.
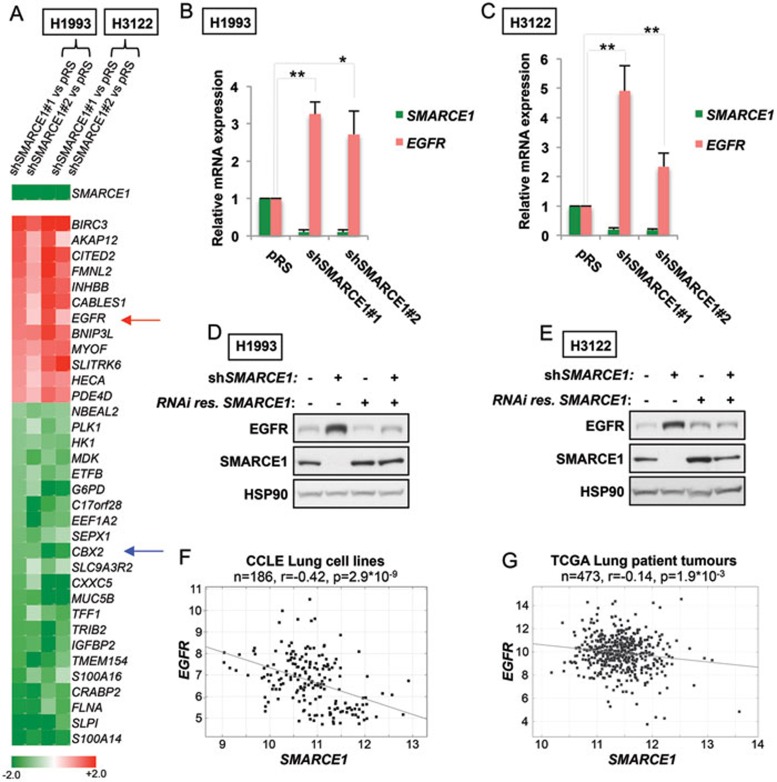
Suppression of SMARCE1 leads to induction of EGFR. (A) Expression heat map of the top genes regulated by SMARCE1 (shSMARCE1 vs pRS control; shSMARCE#2 vs pRS control). Transcriptome expression analysis was performed in H1993 and H3122 cells and multiple SMARCE1-knockdown derivatives using next-generation sequencing (RNA-Seq). EGFR is indicated by red arrow and CBX2 is indicated by blue arrow (Unit: log2). (B, C) Suppression of SMARCE1 leads to induction of EGFR expression. SMARCE1 and EGFR mRNA expression was measured by qRT-PCR in H1993 (B) and H3122 (C) cells stably expressing pRS control or shRNA vectors targeting SMARCE1. Error bars denote SD; * and ** denote P values < 0.05 and < 0.01 of three independent biological replicates, respectively. (D, E) Reconstitution of SMARCE1 suppressed EGFR induction driven by SMARCE1 knockdown. H1993 (D) and H3122 (E) cells expressing pRS control or independent shSMARCE1 vectors were retrovirally infected with viruses containing pMX or pMX-SMARCE1 (RNAi-resistant). Cell lysates were immunoblotted for EGFR, SMARCE1, and HSP90. (F, G) Inverse correlation between SMARCE1 and EGFR expression in a panel of 186 lung cancer cell lines (F) and 473 human lung adenocarcinomas (G). Relative gene expression levels of SMARCE1 and EGFR were acquired from the Cancer Cell Line Encyclopedia (CCLE) and The Cancer Genome Atlas (TCGA). R stands for Pearson product-moment correlation coefficient.

