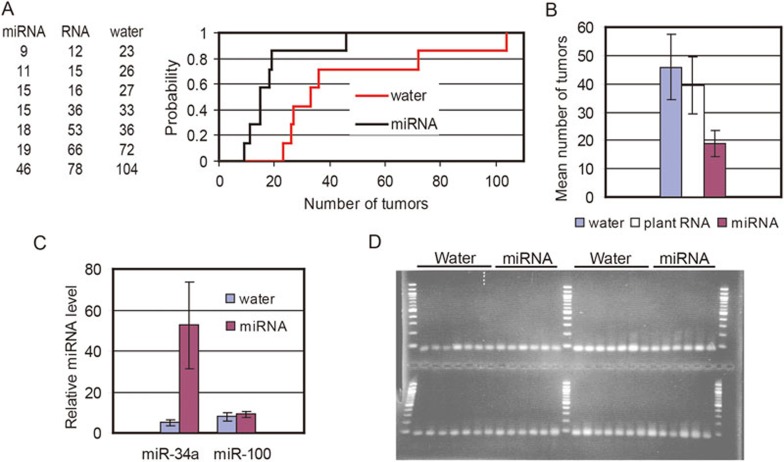
Figure 1.
Orally administered tumor suppressor miRNAs reduce tumor burden in ApcMin/+ mice and are detectable in intestinal tissue. (A) Reduction in tumor burden in miRNA-treated compared to water-treated mice. The table shows the number of tumors in each mouse in the three groups listed in ascending order within each group: miRNA = tumor suppressor miRNA cocktail + total plant RNA; RNA = total plant RNA alone; water = only water. The number of tumors from mice in the miRNA-treated and water-treated groups were plotted to show the distributions that are the basis of the K-S statistical analysis. (B) Mean number of tumors in each treatment group. Error bars show the standard error of the mean. (C, D). Total RNA isolated from intestinal tissue of the mice was oxidized with sodium periodate, and miRNAs were assayed using the miScript-PCR system (Qiagen), which involves polyadenylation of the RNA, reverse transcription, and quantitative real-time PCR (RT-qPCR). Because periodate oxidizes all endogenous RNA controls in the samples, methylated C. elegans miR-39 was added to all samples before oxidation to serve as the normalization control. MiScript-PCR system analysis of samples before oxidation showed that the concentration of the spiked-in miR-39 was the same in all samples. RT-qPCR results showing higher relative miR-34a concentration in miRNA-treated mice compared to water-treated mice. The mean relative miR-34a and miR-100 concentrations in the miRNA-treated and water-treated mice are shown. Error bars are the standard error of the mean (C). Visualization of RT-qPCR products to confirm that a single product of the expected size was amplified in the reactions that assayed miR-34a, miR-100, and miR-39 in intestinal RNA from miRNA-treated and water-treated mice. The RT-qPCR reactions were performed in triplicate, and an aliquot from one of each triplicate was loaded on a 2.5% agarose gel. Each lane represents a sample from an individual mouse: miRNA, samples from miRNA-treated mice; water, samples from water-treated mice. The samples were all electrophoresed on one gel that had been poured using two combs. MiR-100 and control miR-39 reactions from the same PCR run were loaded into the upper wells, with the miR-100 reactions in the left half of the gel. Similarly, miR-34a and miR-39 reactions done in another RT-qPCR run were loaded into the lower wells, with the miR-34a reactions in the left half of the gel. A 100-bp ladder provides the size standards. Ethidium bromide was used to stain the gel (D).

