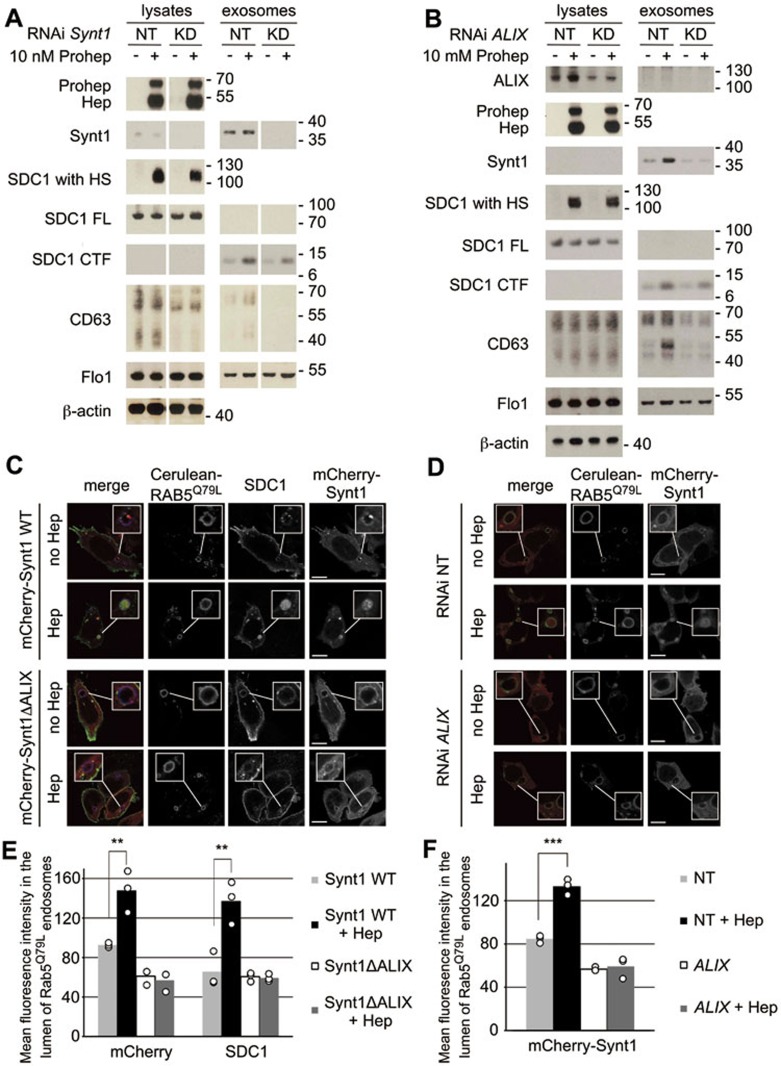
Figure 4.
Heparanase acts through syntenin-1, ALIX and the syntenin-ALIX interaction to stimulate intraluminal budding. (A) The role of syntenin-1 and (B) the role of ALIX in the effect of heparanase on exosomes were investigated by the knockdown of syntenin-1 and ALIX (using Synt1 RNAi and ALIX RNAi, respectively) in MCF-7 cells. Non-targeting RNAi (NT) served as a control. Cells were left untreated (−) or treated with proheparanase (10 nM). In both the experiments, heparanase activity was evaluated using the migration pattern of chondroitinase ABC-, but not heparitinase-treated syndecan-1 present in cell lysates (SDC1 with HS). Molecular weight markers (in kDa) are indicated on the right of each blot. Western blots are representative of two independent experiments. Note that lysate and exosome samples derived from NT and KD cells, separated by a blank space in A, were run in the same gel, but not side by side, and that the band intensities in each row are directly comparable. (C) Confocal micrographs of MCF-7 cells co-transfected with wild-type mCherry-syntenin-1 (mCherry-Synt1 WT) or with mCherry-syntenin-1 harboring mutant LYP sequences and therefore defective in ALIX-binding (mCherry-Synt1-ΔALIX; red in merge), Cerulean-RAB5Q79L (blue in merge) and syndecan-1 (green in merge). Intraluminal budding of wild-type and mutant mCherry-syntenin-1 and of syndecan-1 cytoplasmic domain was scored in the presence (Hep) or absence (no Hep) of heparanase. (D) Confocal micrographs of MCF-7 cells co-transfected with mCherry-syntenin-1 (red in merge) and Cerulean-RAB5Q79L (blue in merge). In addition, the cells were transfected with RNAi targeting ALIX (ALIX RNAi) or with non-targeting RNAi (NT RNAi). Intraluminal budding of mCherry-syntenin-1 was evaluated in the presence (Hep) or absence (no Hep) of heparanase. (E) Quantification of intraluminal budding of mCherry-syntenin-1 and syndecan-1 cytoplasmic domain, as in C and (F) quantitation of intraluminal budding of mCherry-syntenin-1, as in D, measuring the mean fluorescence intensity of mCherry-syntenin-1 and syndecan-1 in the lumen of RAB5Q79L-positive endosomes (mean gray value per pixel). Bar heights represent mean values calculated from three independent experiments, scoring at least 30 cells per experiment. Individual data points are shown as white dots on top of the corresponding bars. **P < 0.05, ***P < 0.01 (Student's t-test, assuming normal distribution of the data points).

