Figure 3.
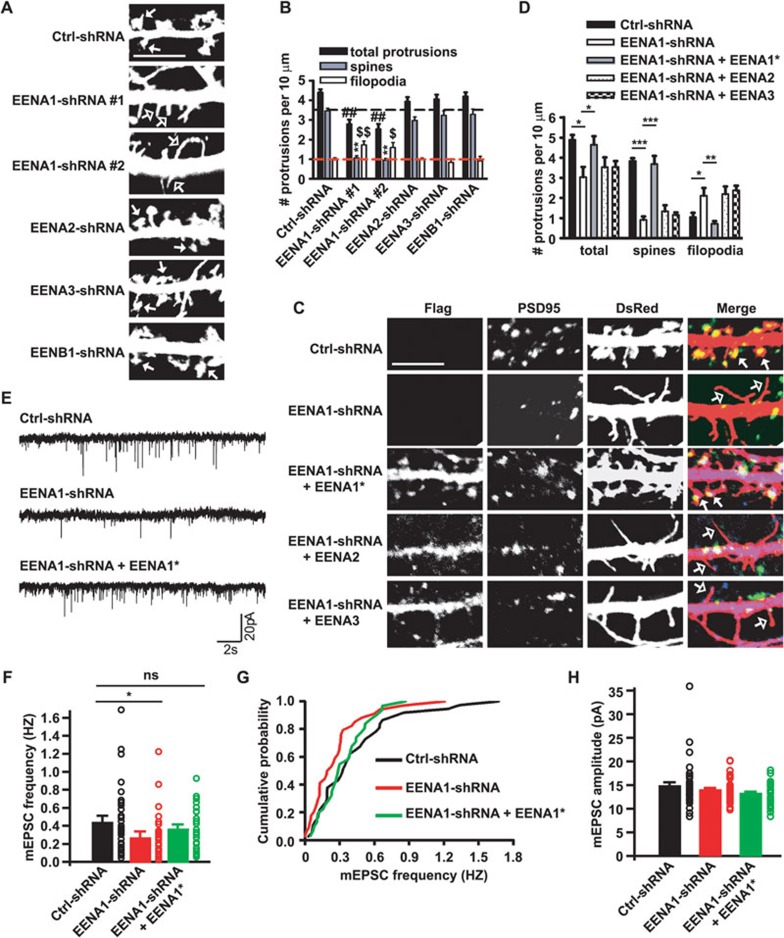
Endophilin A1 is required for dendritic spine morphogenesis and synaptic function. (A) Cultured hippocampal neurons transfected with shRNA constructs coexpressing shRNA and DsRed at DIV16-17 followed by immunostaining with antibodies to DsRed at DIV21. Shown are representative confocal images. Filled arrows, spines; Open arrows, filopodia. Ctrl: non-targeting shRNA. Scale bar, 5 μm. (B) Quantification of dendritic protrusion density of transfected neurons in A (number of cells analyzed, Ctrl-shRNA: 31, EENA1-shRNA #1: 20, EENA1-shRNA #2: 15, EENA2-shRNA: 18, EENA3-shRNA: 17, EENB1-shRNA: 15). In all, more than 600 protrusions were measured for each group. All values are shown as mean ± SEM. Statistical test: ##P < 0.01 (total protrusions), **P < 0.01 (spines), $$P < 0.01, $P < 0.05 (filopodia); one-way ANOVA followed by Dunnett's multiple-comparison post hoc tests. (C) Representative confocal images of cultured hippocampal neurons transfected with shRNA constructs or cotransfected with constructs encoding shRNA and RNAi-resistant Flag-tagged EENA1 (indicated by asterisk), Flag-tagged EENA2, or Flag-tagged EENA3 at DIV16-17 followed by immunostaining with antibodies against PSD95 (green), Flag (blue) and DsRed at DIV21. Filled arrows, spines; open arrows, filopodia. Scale bar, 5 μm. (D) Quantitative analysis of dendritic spine protrusion density in C (number of cells analyzed, Ctrl-shRNA: 18, EENA1-shRNA: 15, EENA1-shRNA + EENA1*: 18, EENA1-shRNA + EENA2: 18, EENA1-shRNA + EENA3: 19). More than 550 protrusions were analyzed for each group. All values are shown as mean ± SEM. Statistical test: ***P < 0.001, **P < 0.01, *P < 0.05; one-way ANOVA followed by Newman-Keuls multiple comparison post hoc tests. (E) Cultured hippocampal neurons were transfected with shRNA constructs or cotransfected with constructs encoding shRNA and RNAi-resistant mCherry-tagged EENA1 (indicated by asterisk) at DIV9-10 followed by mEPSC recording at DIV14-16. Shown are representative traces of mEPSC recordings. (F) Quantitative analysis of mEPSC frequency. Ctrl-shRNA: n = 4 independent experiments, 37 neurons; EENA1-shRNA: n = 4, 34 neurons; EENA1-shRNA + EENA1*: n = 4, 33 neurons. Statistical test: *P < 0.05; one-way ANOVA followed by Dunnett's multiple-comparison post hoc tests. ns, not significant. (G) Cumulative distribution of mEPSC frequency. Statistical test: P= 0.012 for EENA1-shRNA versus Ctrl-shRNA, two-sample Kolmogorov-Smirnov test. (H) Quantitative analysis of mEPSC amplitude.

