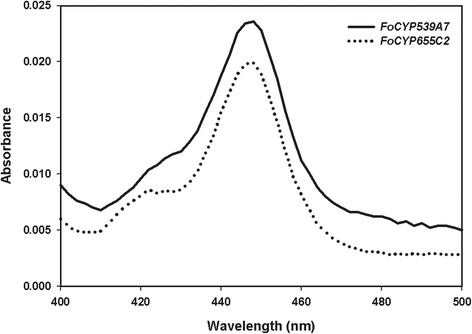
Figure 2.

CO Binding analysis of microsomes of FoCYP539A7 and FoCYP655C2 expressed in S. cerevisiae. The solid line represents FoCYP539A7 and the dotted line represents FoCYP655C2. Yeast expression was carried out in S. cerevisiae cells using 4% galactose, 2 mM 5-ALA at 30°C.
