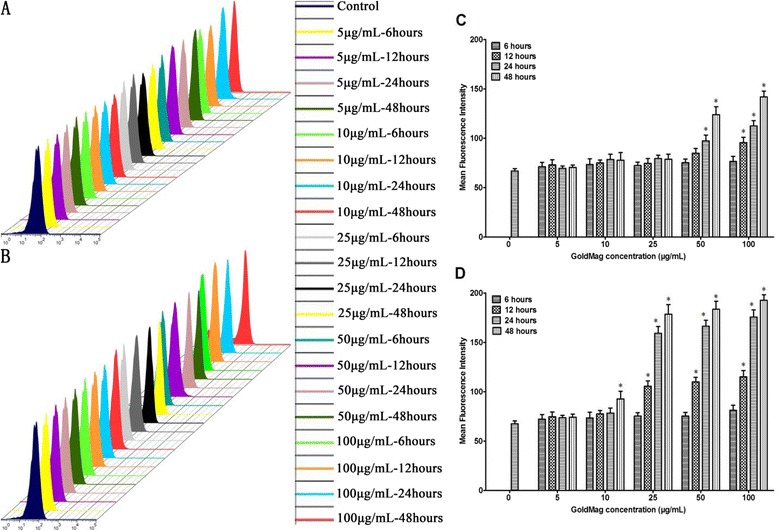
Figure 8.

ROS generation in HUVECs. (A) and (C) for HUVECs labeled with 30 nm GMNPs; (B) and (D) for HUVECs labeled with 50 nm GMNPs. * P < 0.05, compared with the control group. ROS induction depended on size, concentration and time. A significant elevation in the ROS was detected with increasing size, concentration and time.
