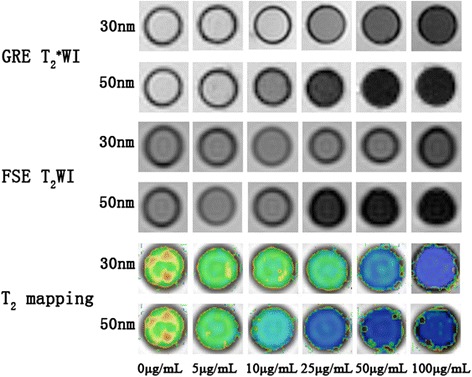
Figure 9.

MR images of HUVECs labeled with different concentrations of 30 and 50 nm GMNPs. With increasing concentrations, the signal intensity of the HUVECs labeled with the 30 and 50 nm GMNPs decreased rapidly. Consistent with the trend of the signal intensity, the T2 relaxation time of the labeled cells decreased with increasing GMNP concentration.
