
Figure 2.
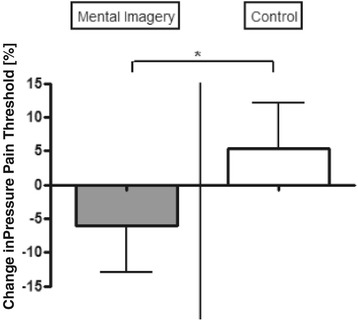
Pain threshold. Pain threshold levels for mental imagery and control groups. Ordinate: Changes in pressure pain threshold level as percentage with respect to baseline value (expressed as: [(t2-t1)/t1] ×100). *p < 0.05 as tested with ANOVA (F(1,27) = 7.40, p = 0.0079) with pressure pain threshold as the dependent variable and group (mental imagery vs control) and time (pre- vs post-intervention) as independent variables. Note that the interaction analyses did not reveal significant results.