
Figure 4.
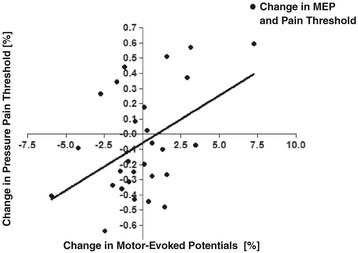
Correlation of changes in pain thresholds and MEP amplitude. Correlation between pain threshold of the left hand and MEP amplitudes. Ordinate: Change in pressure pain threshold [in %]. Abscissa: Change of MEP amplitude [in %]; (r = 0.46; p = 0.015). Changes in pressure pain threshold were calculated as follows: t2 (postintervention value) – t1 (preintervention value). Changes in MEP amplitude were calculated as follows: t2 (postintervention amplitude) – t1 (preintervention amplitude).