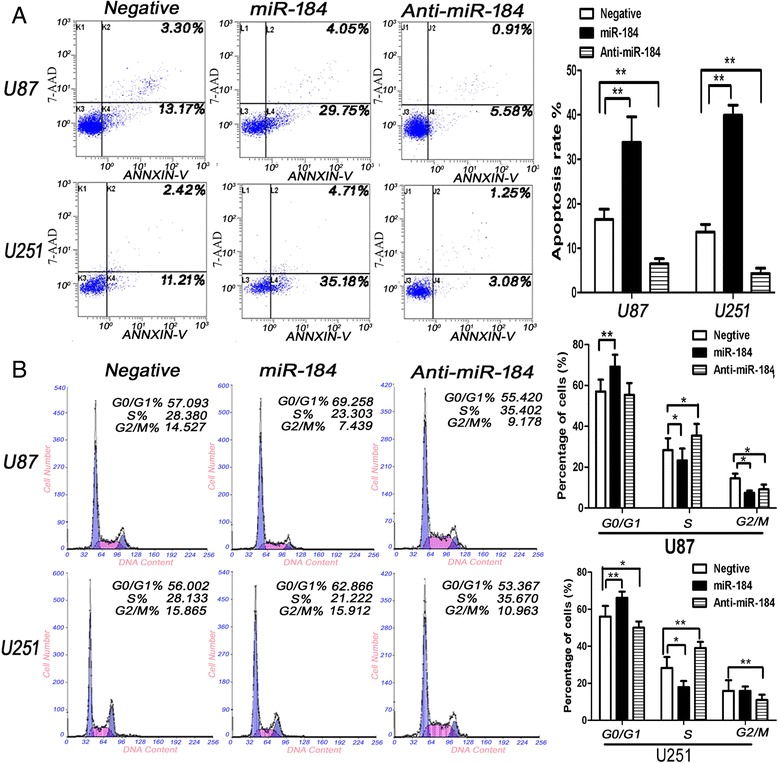
Figure 6.

miR-184 overexpression induced apoptosis and increased the cell population in the G0/G1 phase. A. shows that miR-184 overexpression induced apoptosis in U87 and U251 cells and down-regulated of miR-184 reduced apoptosis compared with Negative group. The left panel shows representative pictures of up-miR-184, which increased the apoptosis of U87 and U251 cells. The right panel shows the relative number of apoptosis cells. B. shows the left panel, in which representative pictures show that miR-184 increased the cell population in the G0/G1 phase and reduced the percentage of cells in the S phase compared with the Negative group. The right panel shows the quantitative data of cells in different cell cycle phases. Data are shown as mean + s.d. (n = 3); *indicates P-value <0.05, **indicates P-value <0.01 VS Mock.
