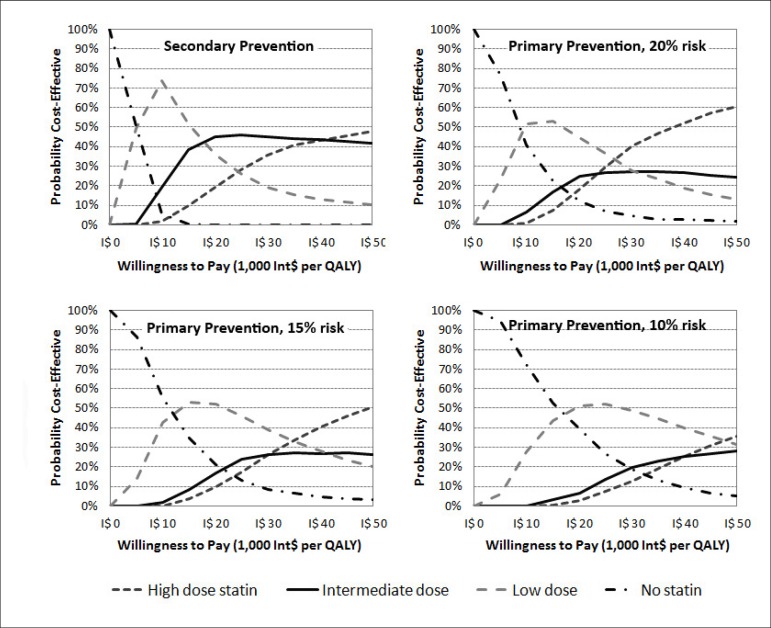
Figure 3.
Cost-effectiveness acceptability curves of alternative scenarios (secondary prevention and 10% to 20% ten-year risk primary prevention), where statin prices were fixed at the retail sales prices of the drugs. The curves show the probabilities that the various statin doses would be cost-effective at varying threshold costeffectiveness values.

