
Figure 2.
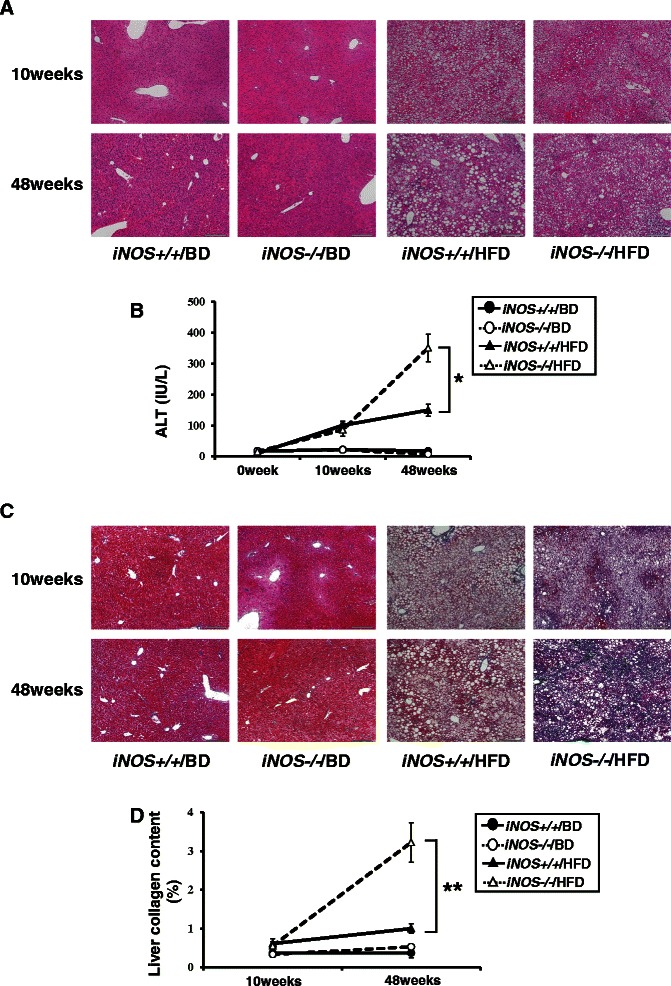
Analysis of liver inflammation and liver fibrosis. (A) Liver samples were stained with H&E. By evaluating the amount of inflammatory foci per field and ballooning, iNOS−/−/HFD mice showed more severe liver inflammation than iNOS+/+/HFD mice at 48 weeks. Scale bar, 200 μm. (B) Serum ALT levels were significantly higher in iNOS−/−/HFD mice than in iNOS+/+/HFD mice at 48 weeks. (C) Liver samples were stained with Masson’s trichrome. No obvious fibrosis is visible in the liver specimens from any group at 10 weeks. While only perivenular and perisinusoidal fibrosis was visible in iNOS+/+/HFD mice, combined pericellular portal fibrosis and bridging fibrosis was visible in iNOS−/−/HFD mice at 48 weeks. Scale bar, 200 μm. (D) Liver collagen content was significantly higher in iNOS−/−/HFD mice than in iNOS+/+/HFD mice at 48 weeks. (Data are expressed as the mean ± SEM. * p < 0.05 and ** p < 0.01, represents significant difference between iNOS+/+/HFD mice and iNOS−/−/HFD mice).