
Figure 3.
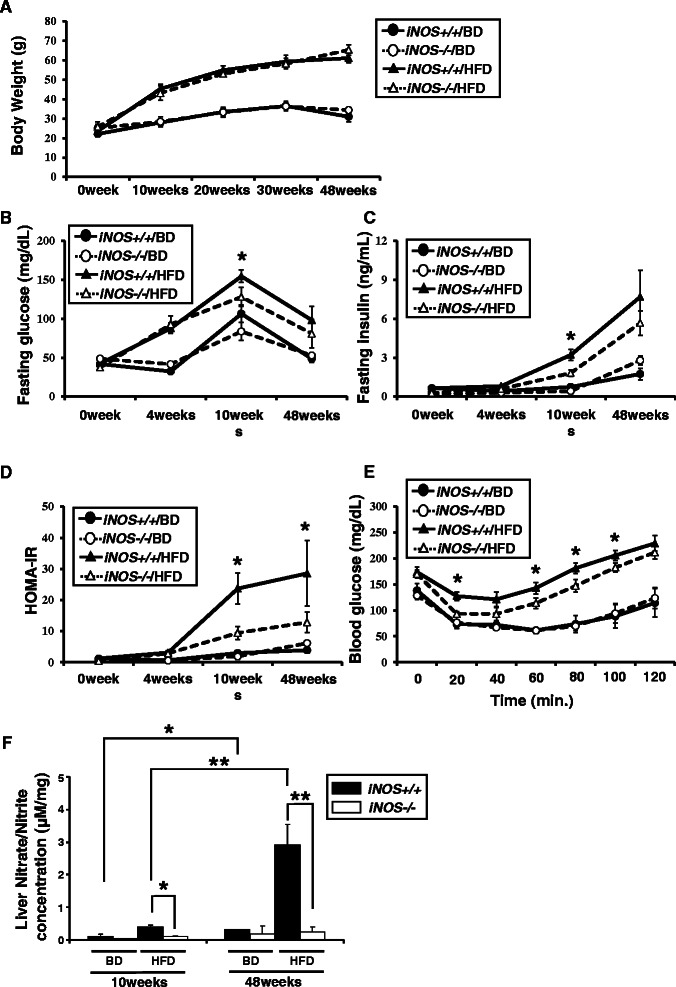
Analysis of factors associated with the pathogenesis of NAFLD: body weight, systemic insulin resistance and liver NO metabolites. (A) No significant difference was observed between iNOS+/+/HFD and iNOS−/−/HFD mice throughout the experimental period. (B, C and D) Fasting glucose and fasting insulin levels were significantly higher in iNOS+/+/HFD mice than in iNOS−/−/HFD mice at 10 weeks. HOMA-IR levels were significantly higher in iNOS+/+/HFD mice than in iNOS−/−/HFD mice at both 10 and 48 weeks. (E) Decreases in blood glucose were significantly greater in iNOS+/+/HFD mice than in iNOS−/−/HFD mice at 20, 60, 80 and 100 minutes after insulin injection. (F) The liver nitrate/nitrite concentrations in iNOS+/+/HFD mice were higher at 48 weeks than at 10 weeks; and other groups showed little concentrations at both 10 and 48 weeks. Liver nitrate/nitrite concentrations were significantly higher in iNOS+/+/HFD mice than in iNOS−/−/HFD mice at both 10 and 48 weeks. (Data are expressed as the mean ± SEM. * p < 0.05 and ** p < 0.01, represents significant difference between iNOS+/+/HFD mice and iNOS−/−/HFD mice).