
Figure 2.
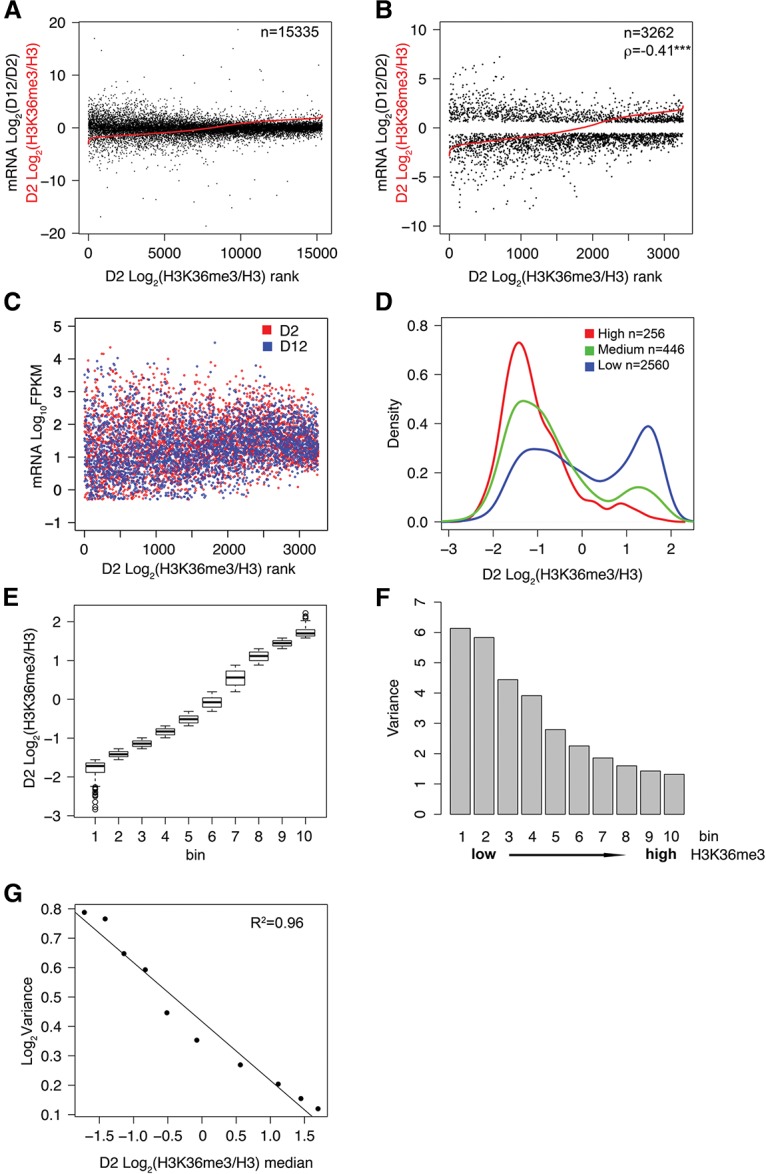
Gene body H3K36me3 level is inversely correlated with gene expression change during aging. (A) All protein-coding transcripts with mappable H3K36me3 ChIP-seq and RNA-seq reads are plotted in the order of normalized H3K36me3 levels at the D2 time point from low (left) to high (right) (shown in red). The corresponding log2 values of age-dependent fold change in mRNA abundance are plotted in black. Average normalized H3K36me3 values were calculated from three biological replicates using Homer. (B) A plot similar to that in A, except only transcripts that were detectably expressed (FPKM >0.5 at D2 and D12) and showed statistically significant age-dependent mRNA abundance change (Q-value < 0.01 from CuffDiff analysis) are plotted. The normalized H3K36me3 value is plotted in red, and the corresponding log2 values of age-dependent fold change in mRNA abundance are plotted in black. (ρ) Spearman's correlation coefficient between absolute values of log2 fold change in mRNA abundance and log2 values of normalized H3K36me3. (***) P-value < 0.001. (C) mRNA levels of transcripts with significant age-dependent change (FPKM >0.5; Q-value < 0.01) are plotted according to the rank of H3K36me3 levels at D2. mRNA levels at D2 and D12 are plotted in red and in blue, respectively. (D) Transcripts plotted in B are divided into three subgroups according to the absolute values of their age-dependent log2 fold change (FC) in mRNA abundance: high, |Log2 FC| > 3; medium, 2 < |Log2 FC| < 3; and low, |Log2 FC| < 2. The X-axis shows the normalized H3K36me3 levels at D2. The Y-axis shows the proportion of transcripts with the corresponding H3K36me3 level for the indicated subgroup. (E) Transcripts plotted in B were divided into 10 bins of equal numbers of transcripts (except bin 10, which had two extra transcripts) according to their normalized H3K36me3 levels from low to high. Box plot showing normalized H3K36me3 levels of genes in each bin. (F) Variance of the age-dependent mRNA abundance change for each bin is shown. Variance represents the spread from the mean of the log2 values of age-dependent fold change in mRNA abundance for the transcripts in each bin: . (G) Regression plot showing variance in mRNA abundance from F as a function of median H3K36me3 levels from E. Gene body H3K36me3 levels and RNA-seq data at D2 and D12 are listed in Supplemental Tables S2 and S3, respectively.