
Figure 4.
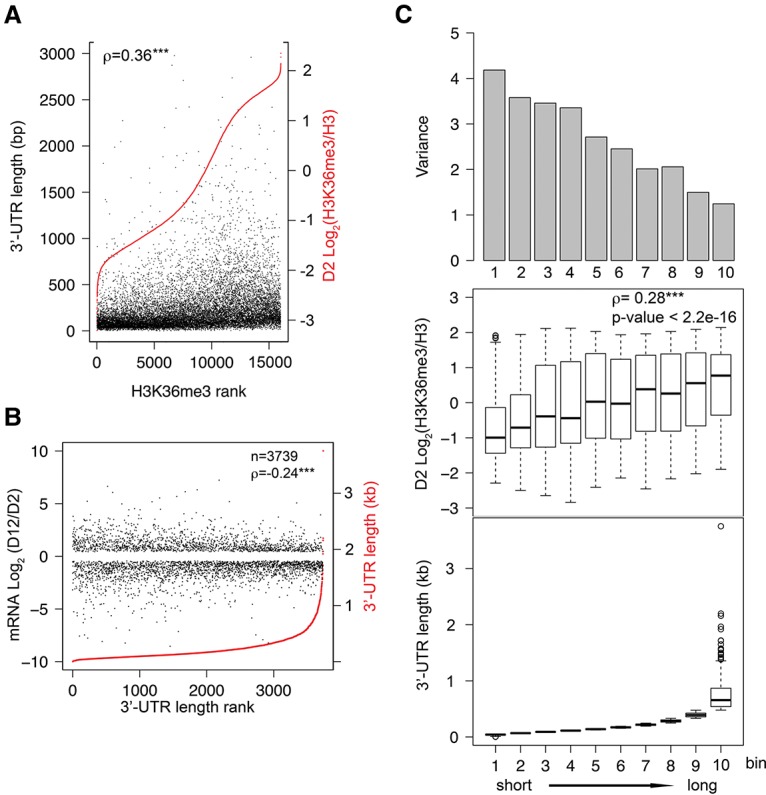
3′ UTR length is correlated with gene body H3K36me3 levels and gene expression change during aging. (A) All protein-coding genes with mappable H3K36me3 ChIP-seq and 3′ UTR annotation are plotted in the order of normalized H3K36me3 levels at the D2 time point from low (left) to high (right) (shown in red). The corresponding gene 3′ UTR lengths are plotted in black. For genes with more than one annotated 3′ UTR, the longest 3′ UTR length was used for the analysis. (ρ) Spearman's correlation coefficient. (***) P-value < 0.001. (B) Genes that were detectably expressed (FPKM >0.5 at D2 and D12) and showed statistically significant age-dependent mRNA abundance change (Q-value < 0.05 from CuffDiff analysis) are plotted in the order of their 3′ UTR length (red) from short (left) to long (right). The corresponding log2 values of age-dependent fold change in mRNA abundance are plotted in black. (ρ) Spearman's correlation coefficient between absolute value of log2 fold change in mRNA abundance and 3′ UTR length. (***) P-value < 0.001. (C) Genes shown in B were divided into 10 bins of similar numbers of genes according to their 3′ UTR length from short (left) to long (right). 3′ UTR length distribution (bottom), H3K36me3 levels (middle), and variance of age-dependent mRNA abundance change (top) of each bin are shown. Spearman's correlation coefficient shows a positive correlation between 3′ UTR length and H3K36me3 level. (***) P-value < 0.001.