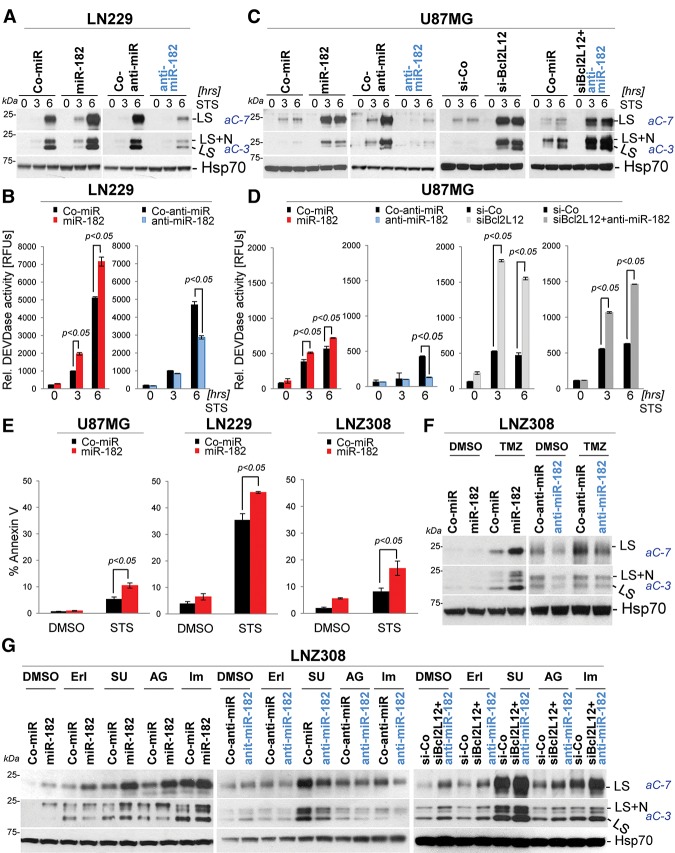
Figure 2.
miR-182 sensitizes glioma cells to therapy-induced apoptosis. (A–D) LN229 and U87MG cells were transfected with 15 nM each Co-miR and miR-182, 50 nM each Co-anti-miR and anti-miR-182, and 100 nM each scramble siRNA or siRNA targeting Bcl2L12 alone and in combination with 100 nM anti-miR-182 (in C,D). After 48 h, cultures were treated with 0.5 μM STS for the indicated periods of time. Activation of caspase-3 (aC-3) and caspase-7 (aC-7) was measured by Western blotting (A,C), and caspase activity was quantified by a fluorometric DEVDase activity assay (B,D). (E) Overall apoptosis was quantified by FACS-based Annexin V staining in U87MG, LN229, and LN308 cells. (F,G) LNZ308 cells were transfected with 15 nM each Co-miR and miR-182, 50 nM each Co-anti-miR and anti-miR-182, and a combination of siRNA and anti-miR-182 sequences for 24 h (in G) and then treated with 100 μM TMZ for 48 h (F) and with 5 μM erlotinib (Erl), 5 μM SU11274 (SU), 5 μM AG1024 (AG), and 5 μM imatinib (Im) (G). Levels of cleaved caspase-3 and caspase-7 were measured by Western blotting. In all cases, Hsp70 is shown as a loading control, and histograms depict mean values ± standard deviations. (LS) Large subunit; (LS+N) large subunit plus N-peptide.

