Figure 2.

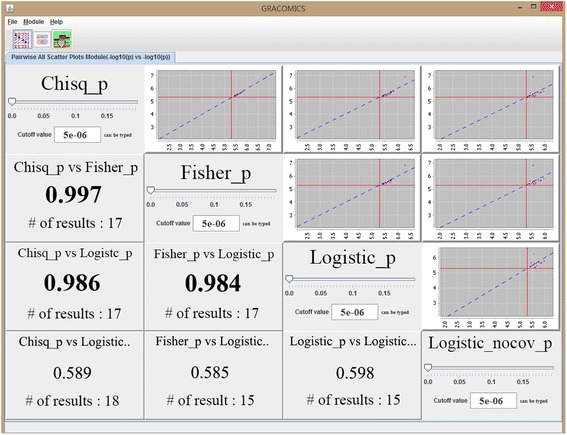
Pair-CSP plot with WTCCC SNP data. Four tests results were compared, and all pairwise scatterplots and their correlation coefficients are given in Pair-CSP.

Pair-CSP plot with WTCCC SNP data. Four tests results were compared, and all pairwise scatterplots and their correlation coefficients are given in Pair-CSP.