Figure 4.

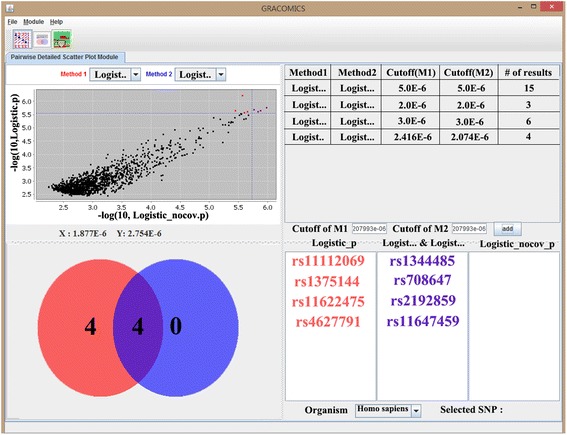
Pair-DSP plot with WTCCC SNP data. Two logistic models, one with and the other without covariates, has been chosen for detailed investigation, Venn diagrams and the summary tables are key features of Pair-DSP.

Pair-DSP plot with WTCCC SNP data. Two logistic models, one with and the other without covariates, has been chosen for detailed investigation, Venn diagrams and the summary tables are key features of Pair-DSP.