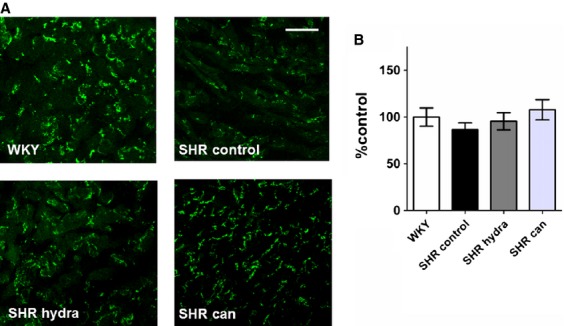
Figure 6.

Effect of antihypertensive treatment on total connexin‐43 expression. (A) Representative sections of anti‐connexin‐43‐stained sections of left atrial tissue. Scale bars represent 50 μm. (B) Mean (±SEM) connexin‐43 expression calculated as percentage fluorescence intensity relative to mean WKY‐control level.
