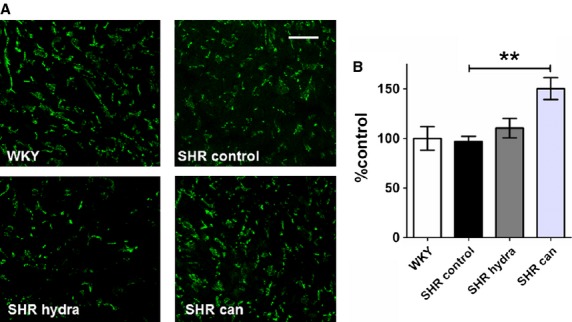
Figure 7.

Effect of antihypertensive treatment on phosphorylated connexin‐43 (connexin‐43P) expression. (A) Representative sections of anti‐connexin‐43P‐stained sections of left atrial tissue. Scale bars represent 50 μm. (B) Mean (±SEM) connexin‐43P expression calculated as percentage fluorescence intensity relative to mean WKY control level. **P < 0.01; Bonferroni's multiple comparisons post hoc test, versus SHR control
