
Figure 2.
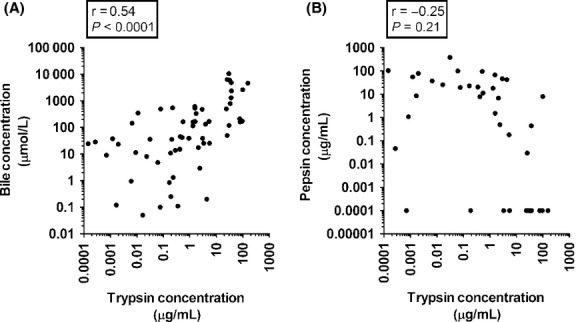
(A) Bile concentration graphed against trypsin concentration (n = 64). Bile concentration is expressed in micromoles per liter and was determined by an enzymatic method as described in the Methods. Trypsin concentration is expressed in micrograms per liter and was determined by ELISA as described in the Methods. (B) Trypsin concentrations graphed against pepsin concentrations (n = 41). Samples with a pepsin concentration that was not detected are not included in the regression statistics.