
Figure 3.
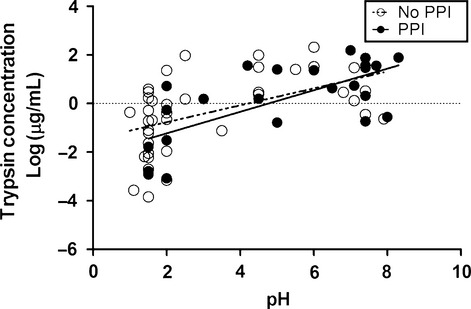
Linear regression between log Trypsin concentration versus pH. Open circles and the dashed line represent samples from patients not on PPIs (n = 39) and corresponding best fit linear regression line. Closed circles and the solid line represent samples from patients on PPIs (n = 24) and the best fit linear regression line for those data.