
Figure 5.
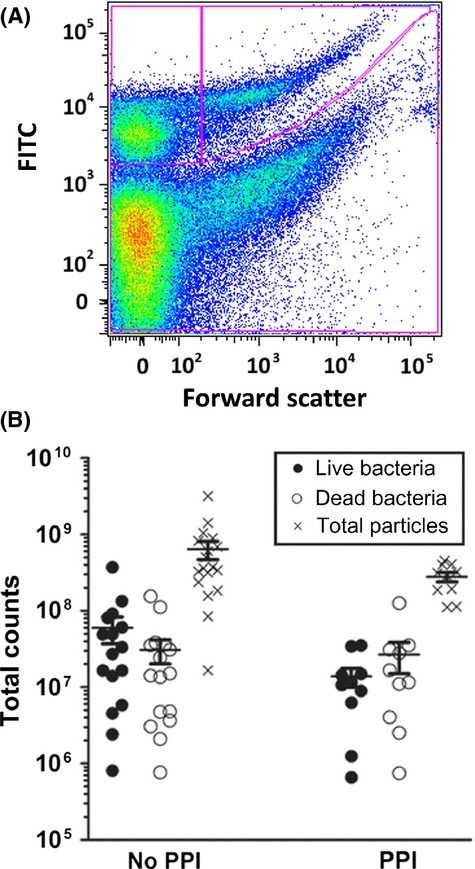
(A) Representative flow cytometry data for a gastric fluid sample. Data were collected as described above and size gates were used to separate live bacteria (top right section indicated by the lines) from bacterial cell fragments (top left section indicated by the lines). (B) Counts of live and dead bacteria versus PPI usage (No PPI, n = 16; PPI, n = 10). The count for a given parameter on each sample is represented by a circle on the graph, closed circle representing live bacteria and open circle representing dead bacteria (particles). Total particle count is represented by an X. The means and standard errors are indicated by the bars.