
Figure 2.
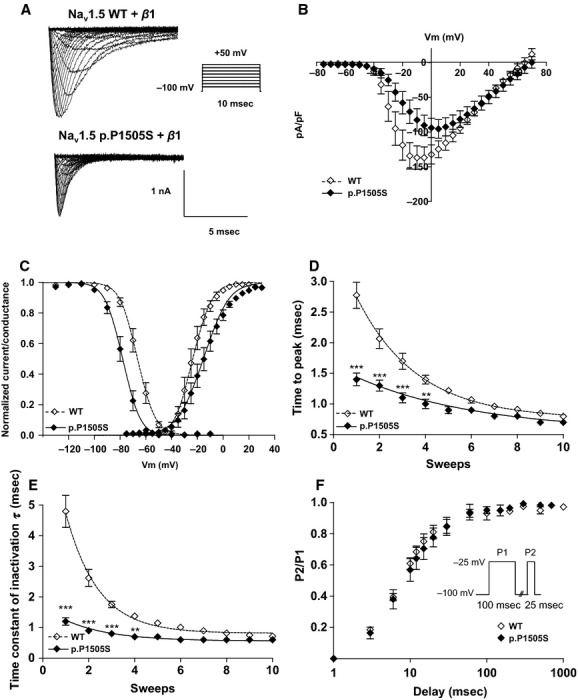
(A) Current traces obtained with inset protocol from Nav1.5‐WT and Nav1.5‐P1505S transfected HEK293 cells. (B) Current‐voltage traces of the Nav1.5‐WT and Nav1.5‐P1505S channels. (C) Steady‐state activation and inactivation curves. Activation properties were determined from I/V relationships by normalizing peak INa to driving force and maximal INa. Parameters for the voltage‐dependence steady state of activation and steady state of inactivation (20‐msec test pulse to ‐10 mV after a 500 msec conditioning prepulse). (D) Sodium current time‐to‐peak values were used to evaluate the activation kinetics. (E) Fast inactivation time constants were measured by fitting the inactivation phase of the Na+ current to a single exponential equation for WT and p.I141V. For D and E, to avoid being biased by the positive shift of the voltage dependence of activation, for each individual cell, the first analyzed potential (sweep 1) was corresponding to the potential for which the amount of the activated channels is more than 20%. For the statistical analysis, a two‐way ANOVA test followed by a Bonferroni correction was used to compare point by point the measured activation and inactivation ***, P < 0.001, **<0.01 versus WT. (F) Recovery from fast inactivation was measured using a twin‐pulse protocol (in inset).