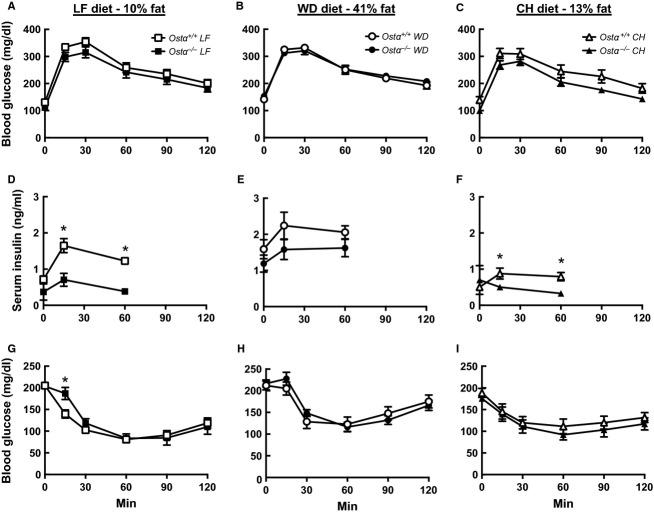
Figure 3.
Glucose tolerance and insulin sensitivity. GTTs were performed in LF‐fed (A), WD‐fed (B), and CH‐fed mice at week 10 following an overnight fast. There were no significant differences in the AUC for panels A, B, or C. Body weights were: 31.4 ± 0.9 and 27.1 ± 0.7* g for wild‐type and Ostα−/− mice on LF diet; 38.7 ± 1.2 and 36.6 ± 1.0 g for wild‐type and Ostα−/− mice on WD; and 29.6 ± 0.6 and 26.6 ± 0.6* g for wild‐type and Ostα−/− mice on CH. Additional blood was collected from tail snips at 0, 15, and 60 min for insulin analysis, shown in panels D, E, and F. Insulin tolerance tests were performed in LF‐fed (G), WD‐fed (H), and CH‐fed mice (I) at week 9 following a 6‐h fast. Values are means ± SE (n = 12–14) *P ≤0.05 versus wild‐type.

