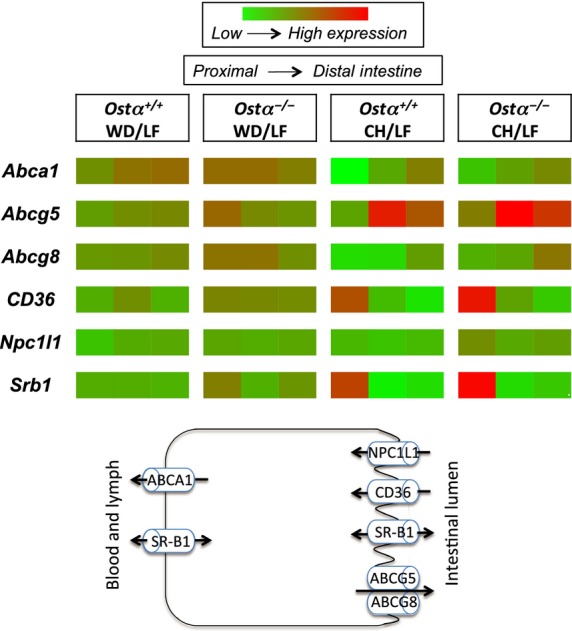
Figure 4.

Effect of genotype, diet, and intestinal segment on expression of genes involved in lipid and cholesterol transport. Data from Table 3 are shown schematically in heat map format using the same scale for all data, depicting the three intestinal segments for each genotype and diet. The scheme portrays major functions of the proteins.
