FIGURE 1.

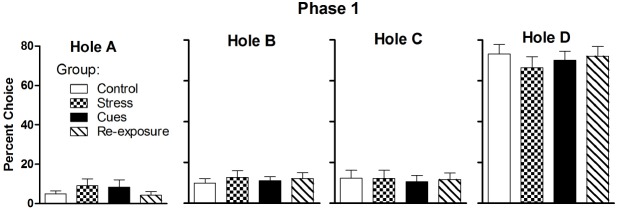
Mean (± SEM) percent choices of each hole made by each group averaged over the final two sessions of Phase 1. The probability of a “loss” (punishment) on Hole D was 0.4 during Phase 1.

Mean (± SEM) percent choices of each hole made by each group averaged over the final two sessions of Phase 1. The probability of a “loss” (punishment) on Hole D was 0.4 during Phase 1.