FIGURE 6.

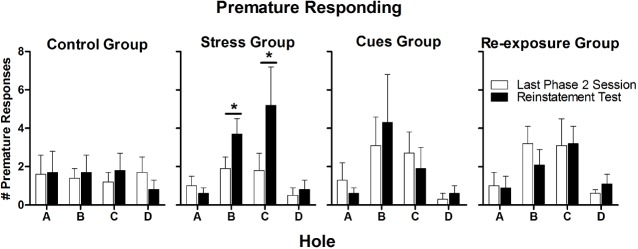
Mean (± SEM) numbers of premature responses made by each group on the final Phase 2 session (white bars) and on the reinstatement test (black bars). *p ≤ 0.05.

Mean (± SEM) numbers of premature responses made by each group on the final Phase 2 session (white bars) and on the reinstatement test (black bars). *p ≤ 0.05.