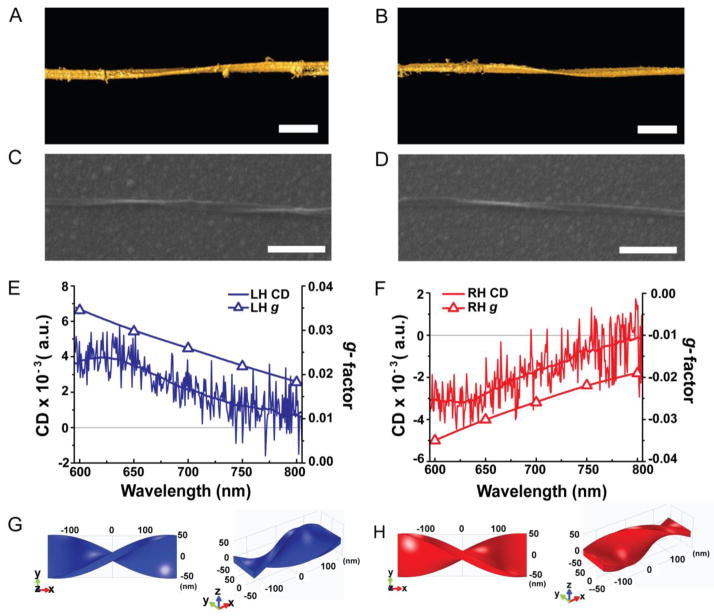
Figure 2. Chirality of single nanoribbons.
A and B, Surface rendering of 3D TEM tomographic reconstruction of LH nanoribbon (A) and RH nanoribbon (B). Scale bars are 100 nm. C and D, SEM images of single LH (C) and RH nanoribbons (D). Scale bars are 500 nm. E and F, CD spectra and calculated g-factor spectra for single LH (E) and RH (F) nanoribbons in C and D, respectively. G and H, Computational models of the LH (G) and RH (H) nanoribbons used in the FEM calculations of chiroptical properties based on numerical solutions of Maxwell equations. All scales are nm.

