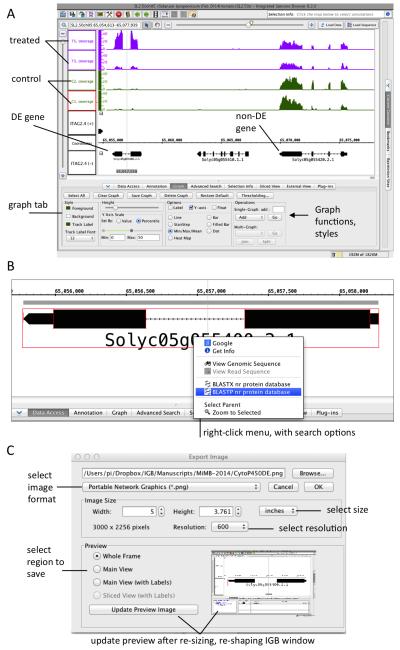
Figure 5. Zooming in on a differentially expressed gene.
(A) Coverage graphs for a differentially expressed (DE) gene. For comparison, a nearby gene that is not differentially expressed is also shown. (B) Right-click context menu. Right-clicking a gene model triggers options to do a BLAST search, view the sequence in a new window, or search Google. (C) Image export. Selecting File > Export Image saves an image file with the current view within IGB.

