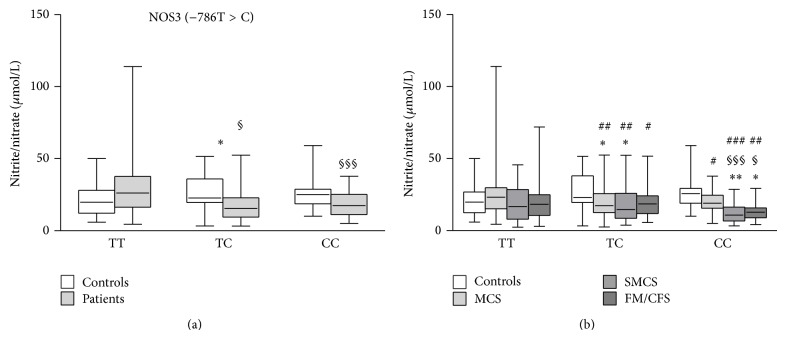
Figure 2.
Effects of different NOS3 −786T>C genotypes on nitrite/nitrate plasma levels in IEI patients (MCS = 170; SMCS = 108; FM/CFS = 89), grouped together (a) or separated (b), and controls (N = 196). Box-plots graphically depict the variation in plasma nitrite/nitrate concentrations of patients and healthy subjects, having different NOS3 −786T>C genotypes, through their quartiles. The bottom and top of the boxes are the first and third quartiles, and the band inside the boxes is the second quartile (the median); lines extending vertically from the boxes (whiskers) indicate variability outside the upper and lower quartiles (the ends of the whiskers represent the minimum and maximum of all of the data). (a) * P < 0.05, significant difference in comparison with controls; § P < 0.05, §§§ P < 0.001, significant difference in comparison with TT patients. (b) * P < 0.05, ** P < 0.01 significant difference in comparison with controls; § P < 0.05, §§§ P < 0.001 significant difference in comparison with TC controls; # P < 0.05, ## P < 0.01, ### P < 0.001 significant difference in comparison with TT MCS.

