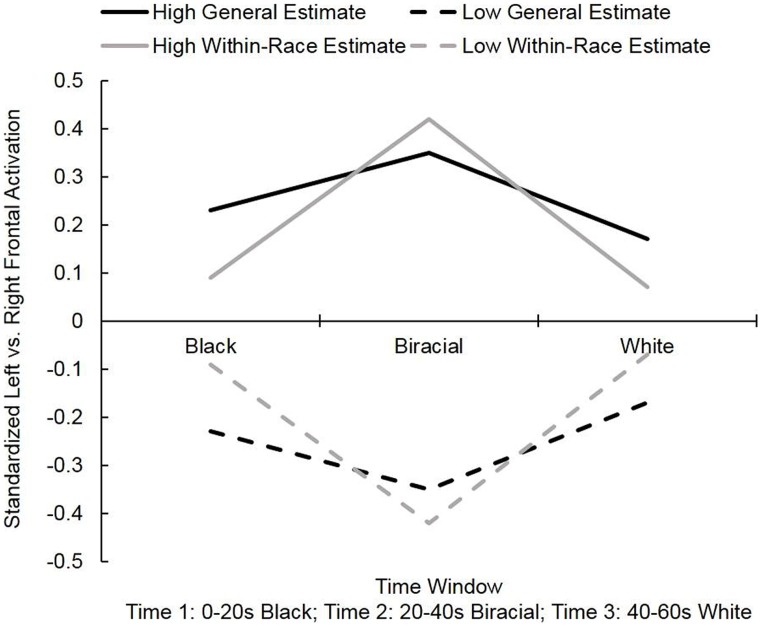
FIGURE 2.
Mean standardized left vs. right frontal activation observed while participants viewed 60-s videos of faces morphing from Black to White [(y > 0 = greater relative left activation (approach); y < 0 = greater relative right activation (withdrawal)] in Study 1. “High” and “low” values represent the frontal asymmetry values of participants at 1 SD above and below the mean on the general and within-race genetic overlap questions.

