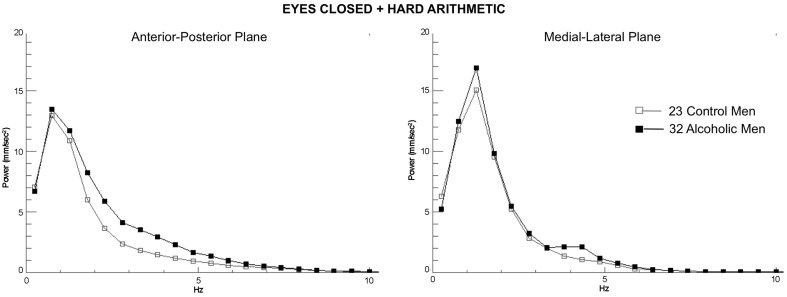
Figure 3.
Group average spectra from the frequency analysis of center-of-pressure sway path velocity (distance/time), presented in ~0.5 Hz frequency bins for the most difficult test condition (eyes closed, hard arithmetic) for the 32 alcoholic men (black lines and filled circles) and 23 control men (gray lines and squares). Spectra from the anterior-posterior plane and the medial-lateral plane are plotted separately.

