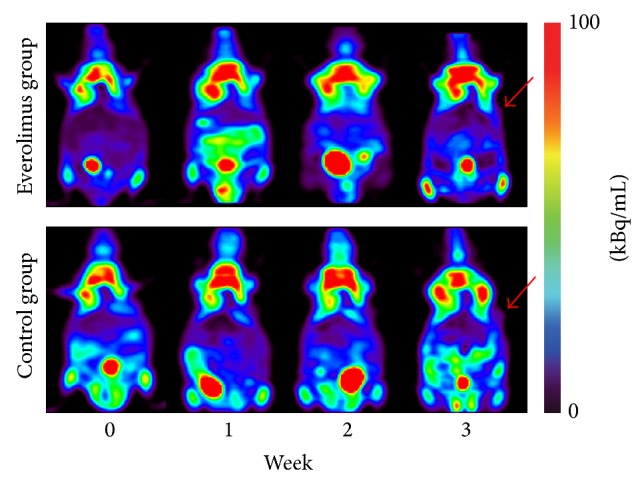
Figure 1.

Serial PET images demonstrating glucose metabolism changes before (week 0) and after everolimus treatment (week 1, week 2, and week 3) in nude mice bearing Bon-1 pancreatic tumor xenografts (red arrows). The two groups are presented as the everolimus treatment group and the control group. Images are shown in axial view. No significant difference of the tumor uptake was found between the two groups at each time point after everolimus treatment.
