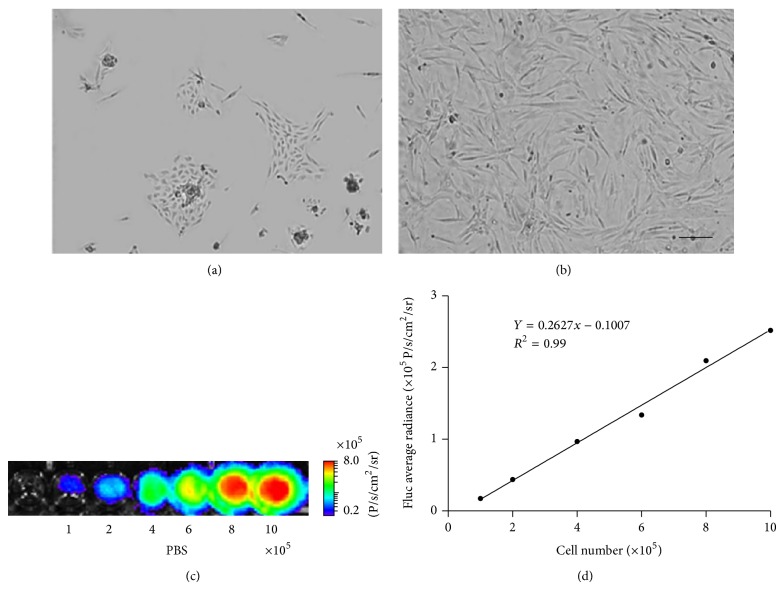
Figure 1.
Morphology and bioluminescence imaging (BLI) of ADMSCsFluc+-eGFP+ in vitro. (a) The morphology of ADMSCs after culture for 24 hours; (b) the morphology of ADMSCs after culture for five days (scale bar, 100 μm); (c) bioluminescence imaging of ADMSCs with different cell numbers. Colored scale bars represent optical radiance intensity in photons/second/cm2/steradian (P/s/cm2/sr); (d) linear correlation of cell quantities with BLI signal was showed.

