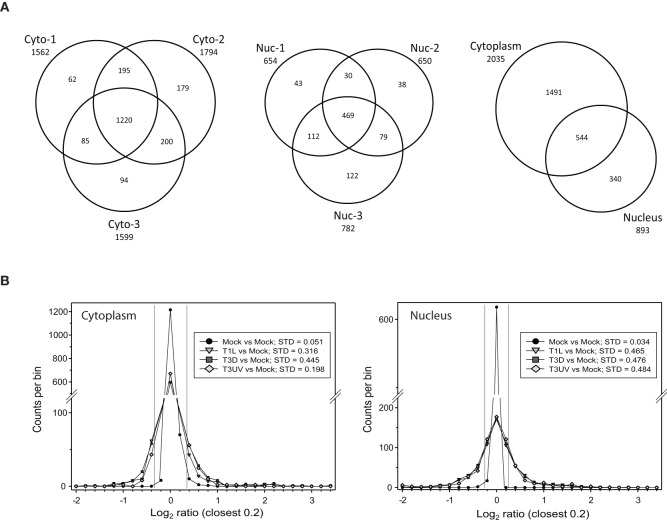
Figure 1.
Distributions of proteins identified in various experiments. (A) Venn diagrams of numbers of identified proteins from various experimental replicates and cell fractions. Cells that were mock infected, or infected with reovirus T1L or T3D, or treated with UV-inactivated T3D, were harvested at 24 hpi, fractionated into the cytosolic (Cyto, left) and nuclei (Nuc, center) fractions and labeled with iTRAQ reagents. Numbers of proteins identified with two or more peptides and at >99% confidence are indicated for each of the three experimental replicates. The total numbers of unique proteins identified in the cytosolic and nuclear fractions are indicated at right. (B) Frequency distributions of identified proteins and their expression ratios (expressed as Log2 fold change compared to Mock) in representative 8-plex iTRAQ samples. The two mock samples were compared to each other and to each of the other six treatments. Standard deviations of the variance in each cytoplasmic (left) and nuclear (right) sample are shown in the box in each plot. The two thin vertical lines represent ±7 σ, corresponding to the limits within which virtually all mock samples fall. Positive values represent up-regulated host proteins in virus-infected cells; negative values represent down-regulated host proteins. Only the distributions of one set of each treatment are shown for clarity.

