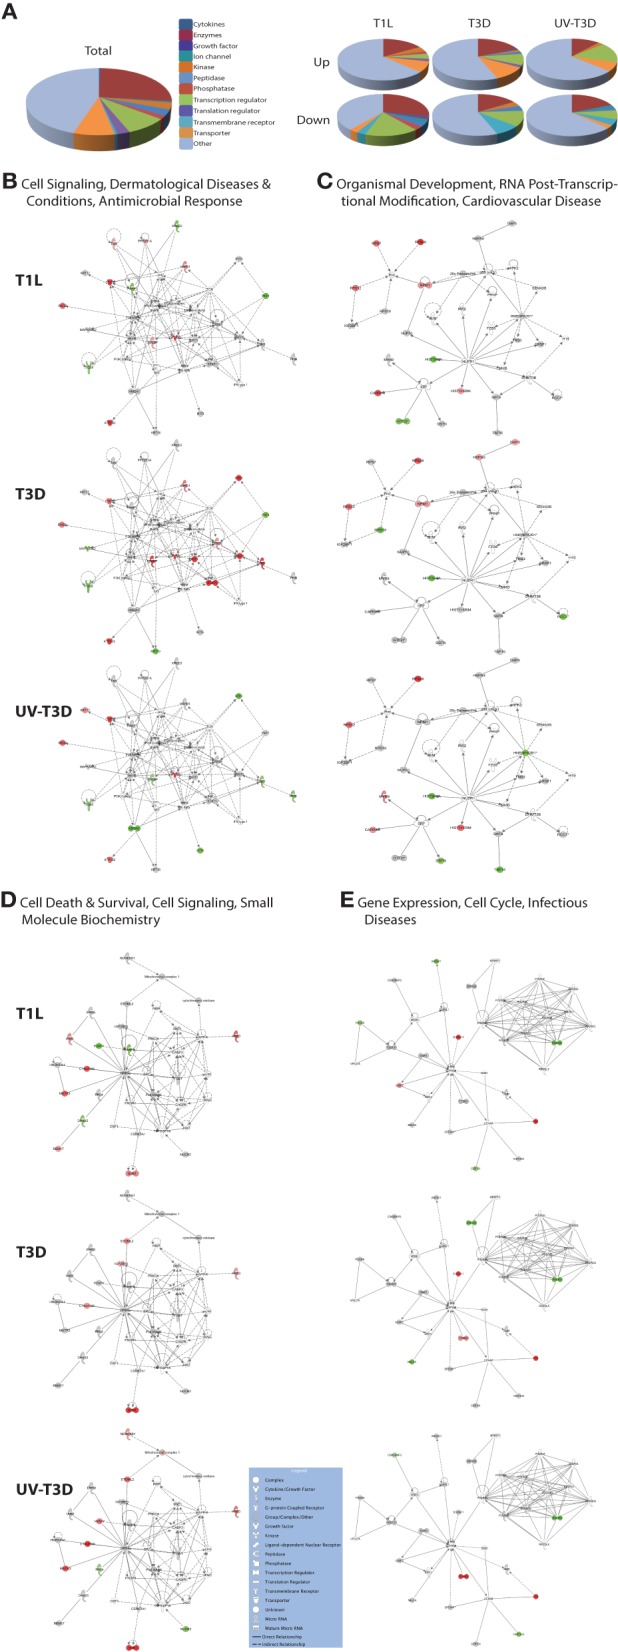
Figure 3.

Molecular pathways of regulated proteins. Proteins and their levels of regulation were imported into the Ingenuity Pathways Analysis (IPA®) tool and interacting pathways were constructed. (A) Ontological classifications of all measured proteins (Total) as well as those significantly up- and down-regulated by each of the viruses. (B–E) The top four IPA networks, identified at 95% confidence and each of which contained 12 or more “focus” molecules (molecules significantly up- or down-regulated), with pathway names indicated. Solid lines: direct known interactions; dashed lines: suspected or indirect interactions. Significantly regulated proteins identified in either the cytosolic or nuclear fractions were overlaid onto each network; red, significantly up-regulated proteins; pink, moderately up-regulated proteins; gray, proteins identified but not significantly regulated; light green, moderately down-regulated proteins; dark green, significantly down-regulated proteins; white, proteins known to be in network, but not identified in our study. Molecular classes are indicated in legend. Additional networks, also with 12 or more “focus” molecules, are depicted in Supplementary Figure S1.
