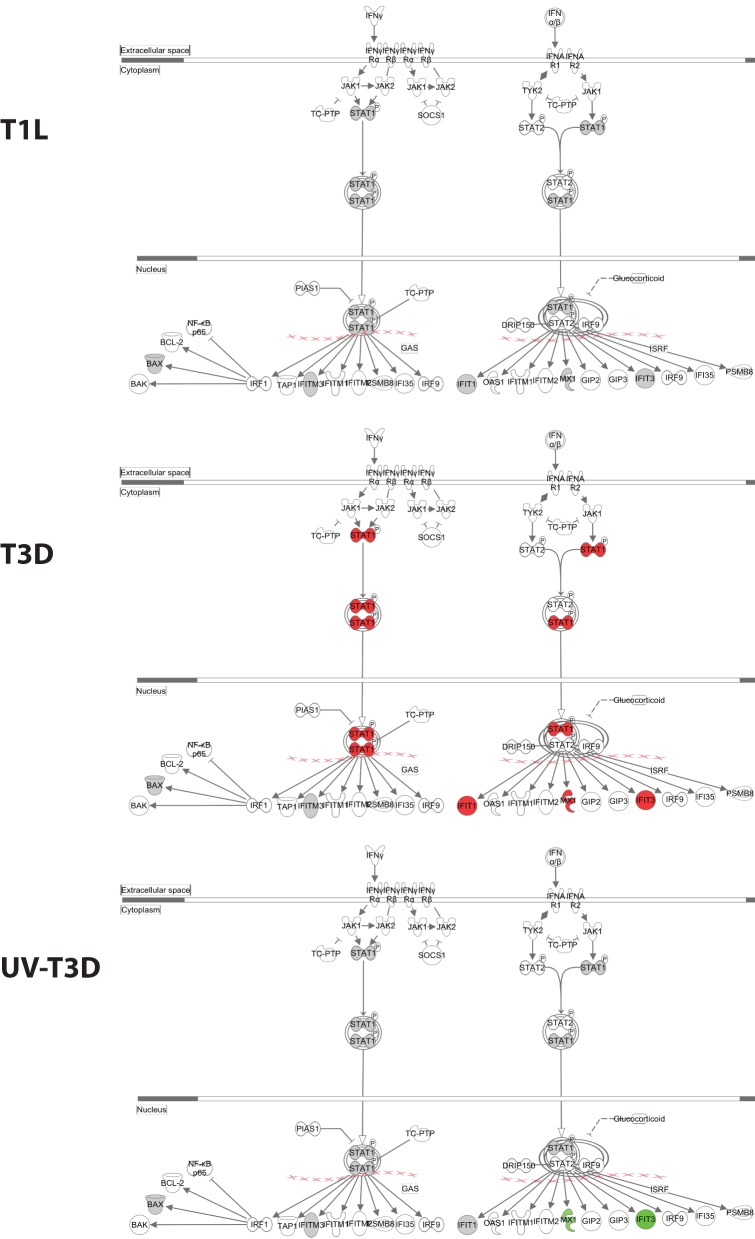
Figure 4.
Significantly affected canonical pathway “interferon signaling”, as determined by IPA® analysis. Red indicates highly up-regulated proteins, light green indicates down-regulated, gray represents not significantly affected, and white represents molecules known to be part of the pathway but not identified by iTRAQ. Examples of additional affected canonical pathways are depicted in Supplementary Figure S2.

