
Figure 1.
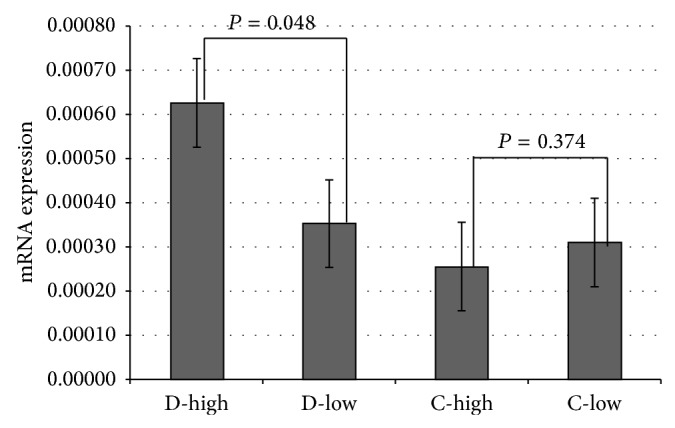
PPARG mRNA expression in blood total leukocytes from VO2max discordant and concordant MZ twins. mRNA expression is shown as ΔCt values in relation to GAPD (reference gene). Results between low and high VO2max within discordant (D-low versus D-high) and concordant (C-low with C-high) pairs were compared by paired Wilcoxon test.