Figure 2.
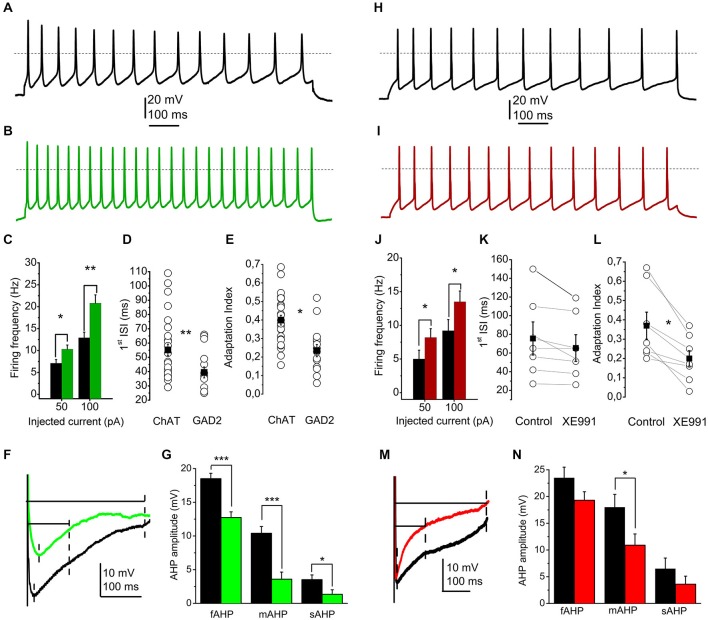
The presence or absence of the M-current contributes to the electrophysiological differences between cholinergic and GABAergic neurons. (A) Train of action potentials recorded from a cholinergic neuron, elicited by 100 pA current injection (black). (B) Train of action potentials from a GABAergic neuron, elicited by the same stimulus (green). (C–E) Statistical comparison of electrophysiological parameters of cholinergic (black) and GABAergic (green) neurons. (C) Current injections elicit higher frequency of action potential firing from GABAergic neurons. (D) Cell type dependence of the first interspike interval (hollow circles: individual data; black squares: average ± SEM). (E) Cell type-dependent changes of the adaptation index (see text; hollow circles: individual data; black squares: average ± SEM). (F,G) Cell type dependence of the amplitudes of afterhyperpolarizations (AHPs). (F) Voltage traces from a cholinergic (black) and a GABAergic (green) neuron. Dashed lines indicate the points where the fast, medium and slow AHPs were determined. (G) Statistical comparison of fast (fAHP), medium (mAHP) and slow AHPs (sAHP). Black: cholinergic; green: GABAergic. (H) Train of action potentials recorded from another cholinergic neuron, recorded under control conditions (black). (I) Train of action potentials recorded from another cholinergic neuron, recorded in the presence of 20 μM XE991 (red). (J–L) Statistical comparison of electrophysiological parameters of cholinergic neurons under control conditions (black) and with 20 μM XE991 (red). (J) Current injections elicit higher frequency of action potential firing in the presence of XE991. (K) Changes of the first interspike interval by application of XE991 (hollow circles: individual data; black squares: average ± SEM). (L) changes of the adaptation index with application of XE991 (see text; hollow circles: individual data; black squares: average ± SEM). (M,N) Effect of XE991 on the amplitudes of AHPs. (M) Voltage traces from a cholinergic neuron under control conditions (black) and in the presence of XE991 (red). Dashed lines indicate the points where the fast, medium and slow AHPs were determined. (N) Statistical comparison of fast (fAHP), medium (mAHP) and slow AHPs (sAHP). Black: control; red: XE991.

