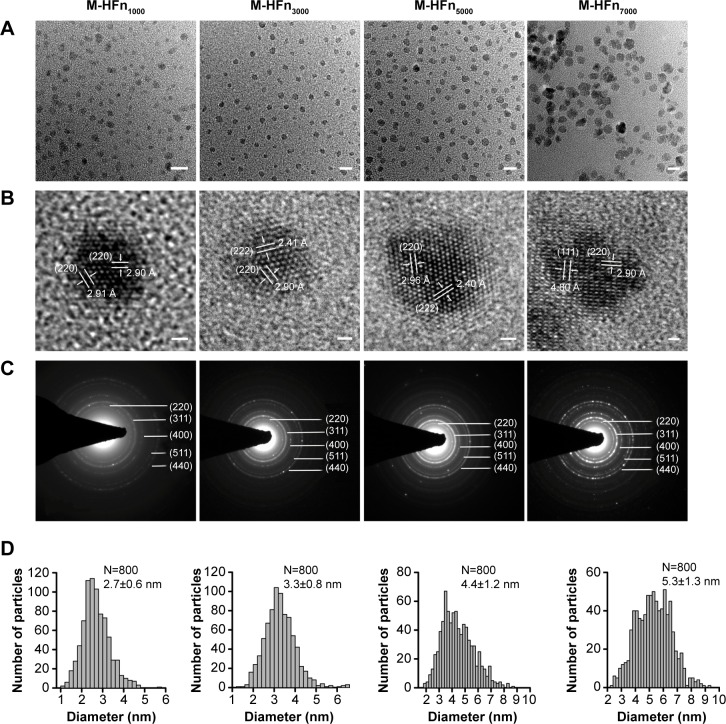
Figure 1.
TEM analysis of M-HFn nanoparticles.
Notes: (A) TEM graphs of M-HFn1000, M-HFn3000, M-HFn5000, and M-HFn7000. Scale bar is 10 nm. (B) The high-resolution TEM images of these four M-HFn samples. Scale bar is 1 nm. (C) Corresponding SAED patterns of M-HFn nanoparticles. (D) Size histograms of M-HFn nanoparticles.
Abbreviations: M-HFn, ferrimagnetic H-ferritin; TEM, transmission electron microscope; SAED, selected area electron diffraction.

