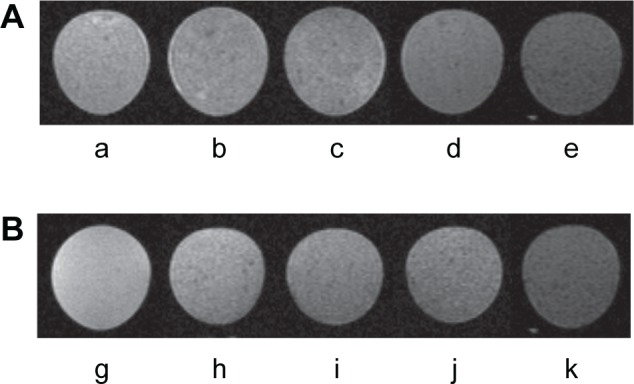
Figure 5.

MRI of MDA-MB-231 tumor cells incubated with M-HFn nanoparticles.
Notes: (A) Evaluation of the efficiency of M-HFn nanoparticles in detecting MDA-MB-231 tumor cells by MRI. T2-weighted MR images of (a) tumor cell-only, and tumor cells incubated with (b) M-HFn1000, (c) M-HFn3000, (d) M-HFn5000, and (e) M-HFn7000. T2 values are 122.5±0.7 ms, 110.9±1.5 ms, 99.1±1.9 ms, 90.0±3.1 ms, and 81.2±2.6 ms (P<0.05, n=3). (B) T2-weighted MR images of tumor cells of different concentrations incubated with M-HFn7000 nanoparticles: (g) 0 cells mL−1, (h) 1×10⁴ cells mL−1, (i) 1×10⁵ cells mL−1, (j) 2×10⁵ cells mL−1, and (k) 3×10⁵ cells mL−1. T2 values are 140.4±3.7 ms, 103.2±0.4 ms, 93.2±0.8 ms, 88.8±0.8 ms, and 81.2±2.6 ms (P<0.05, n=3).
Abbreviation: M-HFn, ferrimagnetic H-ferritin; MR, magnetic resonance; MRI, magnetic resonance imaging.
